Product Updates March 28, 2023
Get a bird’s eye view of your data workflows


Wondering how well your workflows are working—how much data is fueling your business or the impact your team is having? Now you can easily find out.
Our priority is to keep your data flowing into your business to power your processes and actions and to boost your team’s collaboration and productivity. If there’s a blocker, you need to see it from a mile away so you can intervene before it causes a problem.
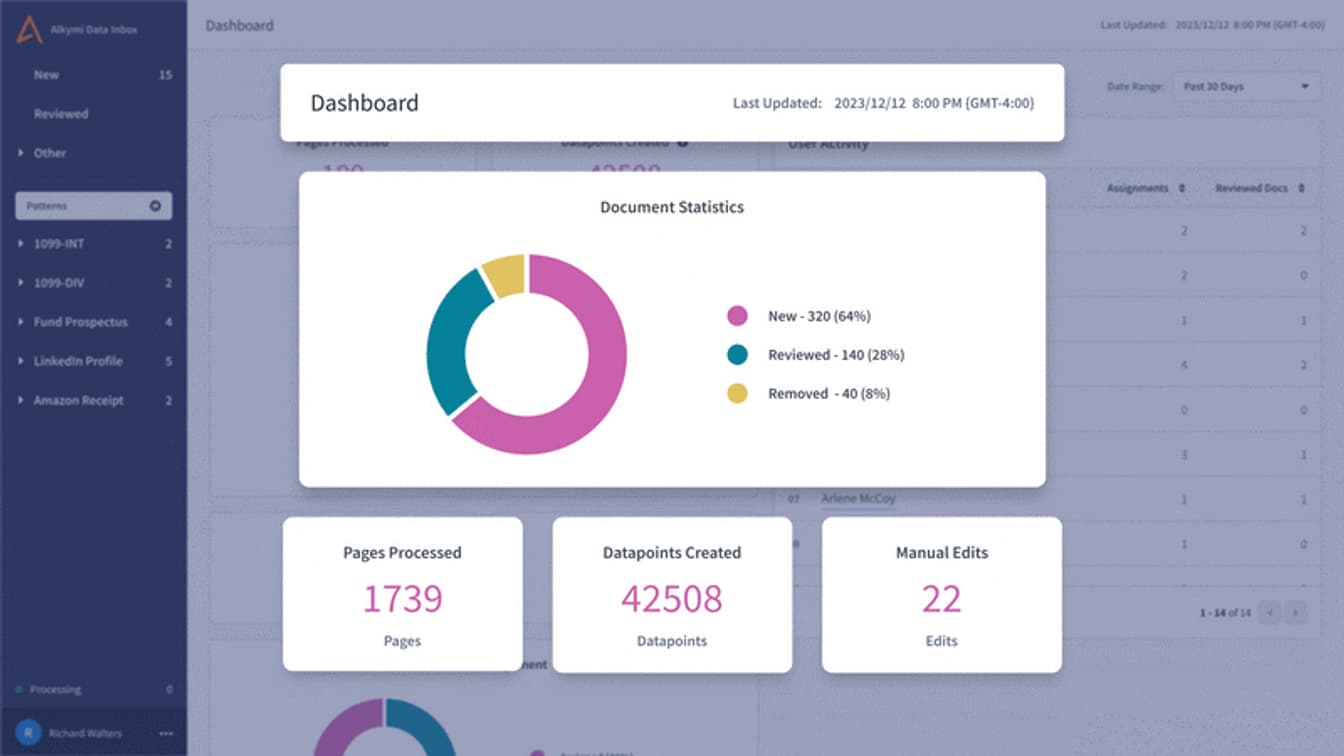
That’s why we’re launching our Dashboard, where you get clear visibility into your data, team and workflow metrics whenever you need them.
The Dashboard gives you an aerial view of what’s happening with your data and your team, across configurable 30-,90-,180-day, or year-to-date periods.
Now you can:
- See the total pages processed to keep up with your data volumes
- Understand the number of actionable data points generated by Alkymi without human intervention
- Track your data quality and automation lift through the number of manual interventions needed
- Get a granular view of your team’s assignments to stay on track and identify opportunities for collaboration
- Catch any blockers early on with a clear view of your backlog
Delivering instantly available, high quality data is key to unlocking transformative automation. The Dashboard is just one of many features we’re planning in 2023 to help you visualize and reconcile your operational metrics to keep your workflows flowing.
Interested in getting the full picture of your data? Schedule a demo.
See the Dashboard in action with the tour below:
More from the blog

Alkymi at the SimCorp Global Summit 2025
by Maria OrlovaHighlights from Alkymi at the SimCorp Global Summit 2025

Alkymi Wins A-Team Innovation Award 2025
by Harald ColletAlkymi wins Most Innovative Unstructured Data Management Project at the A-Team Innovation Awards 2025

Human-in-the-Loop: The Essential Partnership Powering Successful AI
by Keerti HariharanDiscover why AI still needs human insight. Explore how Human-in-the-Loop (HITL) ensures accuracy, trust, and success in real-world AI workflows.